April 30, 2009

Chrysler warranties are safe

Today Chrysler declared bankruptcy. The bankruptcy is a restructuring rather than a liquidation so the company will remain in business but just restructure its debts. Given that news I bet many owners of Chrysler vehicles (including Jeep, Dodge & Chrysler) will wonder if their warranty is still going to be honored. The short answer is that Chrysler warranties will be honored.

This AP article has some Q/A on the bankruptcy and it states:

"Q: Will I still be able to buy a Chrysler? If I already own one, will the company honor my warranty?

A: Yes, the company is expected to operate as it did before, with Chrysler selling cars and existing warranties guaranteed through a government program. ..."

In March the government committed to stand by warranties of GM or Chrysler if either went bankrupt. This Autoweek article on that quotes President Obama on that:
""Let me say this as plainly as I can. If you buy a car from Chrysler or General Motors, you will be able to get your car serviced and repaired just like always," Obama said in a speech. "Your warranty will be safe. In fact, it will be safer than it has ever been. Because starting today, the United States will stand behind your warranty."


April 29, 2009

Appeal Your Property Taxes

Many if not most Americans have seen their home values drop in the past couple years. For many of us this means that we might be taxed for the property at a higher value than it is actually worth. If your home has dropped significantly in value then its pretty unlikely that the tax department has lowered the value of your home. The end result is that you could be paying significantly more in property taxes than your home value really warrants.
If that is the case then you can often appeal your property tax assessment to get it lowered to the current fair market value of the home. The difference can be big. If your home is overvalued substantially then this could have a big impact on your tax bill. If your tax rate is 1% and your home is 20% too high than a typical $200,000 home might be taxed at $240,000. So you're paying 1% tax on $40,000 too much or $400 extra.

Should you Appeal?

You only want to do an appeal if you know your property is over valued on your tax assessment. So the simple question to ask is : Is the assessed value for your taxes higher than the actual fair market value of your home? If so then its worth an appeal. To find out if your property is being taxed too high you have to compare your tax statement with your actual property value. The tax statement part is easy enough if you have the record. Generally you should get something in the mail with your property tax statement that says exactly what the government is valuing your home at. Say you bought your home for $250,000 in 2007 so the county government has the value as $250,000 on your tax statement and they're taxing you on that value. Next you need to find the current fair market value for your home. You could use free sites such as Zillow to do so. For more on Zillow and other such sites see : 4 sites to get quick home estimates. That will give you a rough estimate of the property value. If the rough estimate fair market value is significantly less than the taxed assessment value then it might be worth pursuing an actual appraisal value.

Investigate the Appeal Process

I'd love to tell you exactly how to pursue an appeal but the process will vary from state to state and even from one county to the next. First I'd check your tax statement. Its likely to have some information about an appeal or at least a phone # for the tax office that you can call. If the tax statement doesn't have anything too helpful you can also try searching the web. You can search for your state and "property tax appeal" in Google. For example if you live in Maine then search for "maine property tax appeal". This may or may not lead you to a government website with the details or other pages with relevant information. If you don't find anything on the web you can always call up your county government office on the phone and ask them.

Generally the appeal process will require you to provide some sort of proof or evidence of the true fair market value of the home. There is likely to be a form to fill out. Whatever the exact process is it will depend on how your local/state government does it, but the requirement for an appraisal is pretty common.

Getting an Appraisal Cheaply

If you do a traditional appraisal then you'll probably end up spending something in the $250-$500 range. That is pretty pricey amount to spend especially since you don't know for sure how low/high the appraisal will be or if the property tax appeal will even ultimately work.
There are however there are some online services that will do home appraisals for much lower prices. A few examples : LowerMyAssessment charges $125 for EasyTaxFix will do an appraisal and also fill out the forms to do an appraisal all for $50. The ElectronicAppraiser will give an appraisal with comps for $30. I haven't used any of these online services myself so I'm not sure how well they work. Before you pursue any of these options it would probably be worth contacting your local property tax office and find out what kind of appraisal they need to make sure such online appraisals will satisfy.


If your home has gone down substantially in value and the tax assessment is much more than your current fair market value than appealing your property tax rate is a good idea.

April 28, 2009

Restaurant.com $25 certificate for $2 until April 30th

Take 80% Off with every order of $25 Gift Certificates with code LUCKY and pay $2 thru 4/30/09.


Info on Restaurant.com certificates:

I have used these at my steak house in the past and they worked great. Unfortunately though the steak house stopped taking the certificates. If you're interested in getting a certificate then first check the Restaurant.com site and see what restaurants in your area take the certificates. Second be sure to check out the rules and limitations for the gift certificates. For example a restaurant may require a minimum purchase of $50 to use the $25 certificate and a mandatory 18% gratuity. The rules differ for each restaurant so pay close attention to them. Lastly I wouldn't recommend buying them unless you plan to use them shortly. The restaurants that accept the certificates can change over time.

For more on saving money at restaurants see my older posts:

April 27, 2009

Another article on Gold as an Inflation Hedge

The other day I wrote asking : Is Gold a Good Inflation Hedge? My conclusion was a solid 'no'.

Today My Money Blog wrote about the same topic with their article: Should I Buy Gold Now To Hedge Against Future Inflation? They give a pointer to a video from author Larry Swedroe who discusses the topic. They have the same conclusion I did.

April 26, 2009

Step by Step guide to Get Your Free Annual Credit Report

Welcome Clark Howard viewers. If you enjoy this article then consider subscribing to the site via the links in the upper left.

Note: The article below was written in 2009 and has not been updated for some time.
For a more recent, nice video on the topic see CafeCredit.com's article:  How To Get Credit Reports From All 3 bureaus?

--

You are entitled to get a free credit report from all 3 of the major credit bureaus once every year. Its a good idea to check your reports and its FREE once a year so theres no reason not to do so. To do so go to the website AnnualCreditReport.com This is the official site offered through the credit bureaus to provide a free report to everyone.    According to the Federal Trade Commission, AnnualCreditReport.com is the ONLY authorized source to get your free annual credit report under federal law.

Why check your Credit Reports

Its a good idea to check your credit reports to make sure that everything is accurate. The credit bureaus often make errors so you should check that they've got everything right. Checking your reports is also a good way to keep an eye out for unauthorized activity that is often a sign of identity theft.

Warning: Don't be confused with other sites offering free credit reports that advertise heavily. The other sites are going to try to get you to sign up for a free trial service and then kick in a monthly fee. Make sure you go to AnnualCreditReport.com. AnnualCreditReport.com is the real site.

Credit Report versus FICO score

Your Credit report is the full detail on all your credit accounts. It will track your payments on all your loans and credit cards. The credit report is different than your credit score. Your credit score is a number from the Fair Isaac company. The number ranges from 300 to 850. Read more about it in the online guide: Understanding Your FICO Score.

To Buy Extras or not?

In my step by step guide below I recommend against buying additional services. The point here is to get a FREE annual credit report so you can check up on your credit records. The credit bureaus all want to sell you something extra in the process. You can get your Fico Scores/Reports from myFICO.com.   They have a few offerings there. One is to get all of your FICO scores in a package deal. If you're interested in getting one or more FICO scores I'd take a look at myFICO first and see what their prices are.   But you don't really NEED to spend the extra money to get the actual FICO scores. Checking your credit reports should be good to tell you if everything there is OK. [edit, you can also get 12% off Equifax FICO scores via Ebates.]

Edit Update: As of earlier this year Experian, one of the 3 credit bureaus, is currently not offering their credit score via myFICO.com. See more about that at this page from myFICO. Hopefully the 2 parties will find some agreement so people can continue to get all 3 FICO scores via myFICO.

How to get your FREE credit reports

The process to get your credit reports from AnnualCreditReport.com is pretty easy. At the site you can get reports from TransUnion, Equifax and Experion.


Here is the process to get your annual free credit reports step by step

1) Log onto AnnualCreditReport.com. The site should look like this:

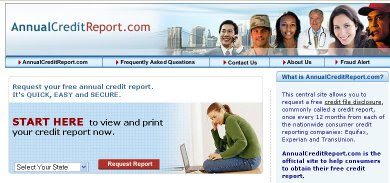
Pick your state in the 'start here' section shown and then hit the personal report button.

2) Give personal information. You'll next get to a page where you give them your name, date of birth, address and social security. Fill in all that information.

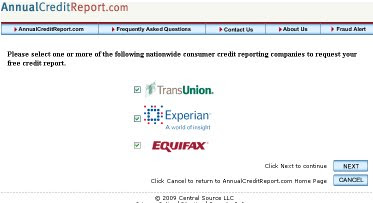
3) Then you get an option to pick the credit bureaus you want the free report from. You should get all 3 so go ahead and select them all:
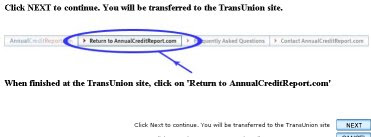
Next you'll be shown a page indicating that you're going to be rerouted to the TransUnion site to get your free report there:


From here you'll visit each of the 3 credit bureau sites in turn and get reports from them. When you get to a credit bureau you may have to verify some questions about your loan or credit accounts. They may ask you a few multiple choice questions. For example they may say "In July of 2003 you may have opened a mortgage..." and then ask you what company has your mortgage. Do not be alarmed if you don't t recognize everything in the questions asked. I got a question from one bureau asking me if people lived with me that I didn't recognize. These may be questions to differentiate you from another person with the same name or they may be trick questions. Simply answer all the questions honestly.


4) Get your Transunion report

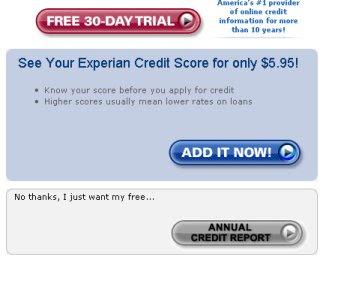
When you get to the TransUnion site they will make you click through some stuff. They are going to offer additional stuff you can buy from them. If you want to buy a credit score then that will be extra. 
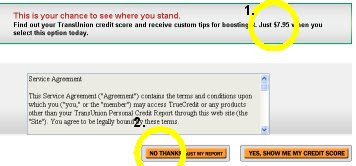
I'd recommend saying NO Thanks to these extra offers.

Transunion's sales pitch pictured below. 1) they offer a credit score for $7.95 extra and 2) hit 'no thanks' to decline extra stuff:


Once you get past the sales pitches you'll get the full credit report. The credit report will have entries for any kind of loan or credit card you've had. Mortgages, student loans, car loans, charge cards, and credit cards will all be listed.

6) Review the TransUnion report for accuracy.
The TransUnion report will have entries for each item similar to my Discover card entry below:
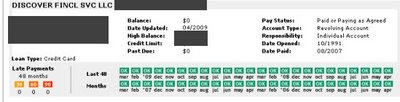
I've blacked out some stuff to obscure details.

Carefully look through all your entries in the credit report. Make sure you recognize everything there and that everything is accurate. If you've missed payments then they will show up with orange/red tone color boxes. I've done a good job making my Discover card payments and all the boxes are green. This is what you want.

Its a good idea to save a copy of the TransUnion report for your reference.

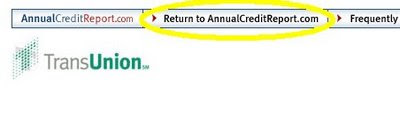
When you're done at TransUnion click on the link at the top of the page to Return to AnnualCreditReport.com :

7) Get and review your Experian report Continue on and go to the Experian site.

Again they will try to sell you other services. I'd recommend declining these offers.

You'll then get to a point that you can access your full Experian credit report. Go ahead and save a copy of the report for your records. Experians reports look different than TransUnion's. Here is a screenshot of my Discover card record with Experian:

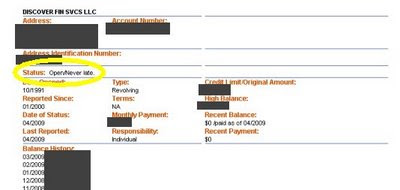
Again you should check out all of the records in the report and make sure that everything is accurate. One key to look for is the "Status" entry as circle in yellow in the picture above. If the status says "never late" or anything like that then you're doing fine. So "Open/never late", "Paid, Closed / never late" or "Transferred / never late" are all good.

8) Get your Equifax report and review it.

Unfortunately I can't give all the details on getting your Equifax report. I had problems with their website and was unable to get my report. But I've done it in previous years so I remember what its like. The process to get the Equifax report is pretty similar to the other two bureaus. When you get to the site they'll try and pitch an extra service and it's probably best to decline that. Then you'll get your full report. Save a copy of the report for your records. The formatting of the report will differ from Transunion and Experian a little bit.


Dealing with problems

Hopefully everything on your credit report is accurate. But if there are any inaccuracies or activity that you did not authorize then you should deal with it soon. Errors on your report could be hurting your credit score and unauthorized activity is a sign of potential fraud such as identity theft. If you find anything on your reports that shouldn't be there then you should contact the individual bureau to deal with it.

If you are unable to get a report from one of the bureaus online then I'd recommend you call their toll free number to find out why and request a report.   If it doesn't work online then you may have entered information incorrectly so make sure to double check what you give for answers before you hit submit.

April 24, 2009

Best of blog posts for week of April 24th

FMF posts a Recap of Dave Ramsey's Town Hall for Hope after attending the event at his local church.

Jim at Bargaineering has a nice discussion of bonds with the article : Buying Municipal or State Bonds

Updown performance = -20.3%

Practice invest


My Updown account is currently down 20.3% since I started. Last time I looked at the account I was down -33% since starting. So I've rebounded a ways. My 20.3% loss is still beating the S&P 500 which is down 35.9% for the same time period.

Good months and bad months


My performance on Updown has not been very consistent. I have good months and bad months. Right now April is looking like a good month. I'm up 11% for April.

Here's a table of my recent monthly performance from the Updown site:


You can see that April, March and December were all good months. February, January, November and October were bad months. I think this is mainly due to the market volatility we've had in the past half year. Every other day it seems there is new economic news that upsets the market in some way.

Updown is a fun game and a good way to learn about stocks without risking real money. And if you do well then you can make some actual money too. I've made a .. brace yourself.. drum roll... I've made a whopping $1.44 so far.

April 22, 2009

Easily Save Money and Be Green

Today is Earth Day. In that spirit here are a few easy ways to save some money and help the environment at the same time:

Compact Fluorescent Lamps (CFL) -
CFL's are a good way to save money and save energy at the same time. I save over $60 a year in electricity by using them myself. Today only you can get a free CFL at Home Depot since they are giving out 1 million of them for Earth Day.

Recycle Aluminum Cans
- Many states have a deposit so you can get 5¢ or 10¢ per can. It should list right on the can which states have deposits. If your state has a deposit then redeeming your deposit is the best way to go. But if your state does not have a deposit then you can take your aluminum cans to a metal recycling center and they will pay you for them. I don't mean just a drop off site, but a business that recycles metals. You should be able to find such local metal recyclers in your area with a quick Google search or checking your yellow pages. Aluminum cans are currently fetching around 20-25¢ per pound at recyclers. That works out to something in the ballpark of 1¢ per aluminum can. Of course you should pile up a bunch of them so you make one trip and recycle many pounds worth.

Stop using Bottled Water - I wrote before how you can save over $100 annually if you Use a filter instead of buying bottled water.

Drive Better - Simply changing your driving habits can have a big impact on your fuel efficiency. If you cut your speeding and avoid fast acceleration and braking then you could cut your gas use by as much as 33%. Following this and other gas saving tips will cut your gas use and save you money and waste less gasoline.

Is Gold a good Infation hedge?

It seems pretty common to hear that gold makes a good hedge against inflation. At first I accepted this concept without any examination. It just seemed to "make sense". But then I thought about what I'd seen gold prices do in the past and I didn't really see much there that showed gold prices correlating to inflation. There is a period in the 1970's when gold went up and inflation was high. But thats just one decade. Other than the 70's I haven't seen any real relationship between gold and inflation.

I decided to look at annual changes in gold prices versus annual inflation rates. I got inflation data from BLS and the gold prices from Kitco. I plot the annual percent changes for gold and inflation in the graph below:
Do you see a very strong correlation between those lines? I don't. Gold prices seem to bounce all over. If there were a direct correlation between gold and inflation in time periods of a few years you'd expect to see stronger correlation between those two lines.

Here is a very detailed and interesting examination of the relationship between gold and inflation: Is Gold an Inflation Hedge?

A professor looked at the relationship between gold and inflation over a 17 year period and concluded: "What the above tells you is that the widely held belief that gold goes up when the dollar goes down is not supported by the statistics: a -0.28 correlation is a weak correlation at best and is certainly within the normal volatility that these two date series exhibit."

That same article has a nice graph showing how from the 1970's to about 2000 the price of gold went down overall while inflation consistently drove prices up. That is opposite to the idea that gold is a good inflation hedge. If gold were a good inflation hedge then the price of gold would have gone up steadily decade over decade. But from 1980 to 2001 the price of gold dropped.

I don't see any strong evidence that gold is a dependable inflation hedge for any short term periods.

April 21, 2009

Jim Cramer versus a Monkey : who wins?

A little while ago Jon Stewart, host of The Daily Show, was criticizing CNBC and Jim Cramer. Check out this video of Jon Stewart inverviewing Jim Cramer: Part 1, Part 2 and Part 3. In my opinion Jon Stewart was a bit overly critical of Cramer's stock picking. Sure Cramer made an error when suggesting people should buy Bear Stearns. But Jim Cramer picks stocks on a daily basis and makes 100's of stock suggestions every year. With that many picks its guaranteed that he'll make a lot of bad choices. Any professional money manager will make some bad choices. We can't expect Jim Cramer to be 100% perfect in his stock picks. The real test is of their overall performance. But this then raises the question : How good is Cramer at picking stocks?

This site YourMoneyWatch tracks Jim Cramer's picks and then determines the performance track record of all his stocks for each year and since the start. Since they started tracking his picks in 2005, Cramer has had a +7% return. Now if you compare that to the indexces he's doing significantly better. Cramer's picks have beat the Dow, S&P 500, NASDAQ and Russell 3000 every year since 2006.

Thats not bad at all. I'd say Cramer is doing pretty well.

But how hard is it really to beat the indexes? Could you or I do as well as Cramer?

What if you asked a monkey to pick stocks, could they beat Jim Cramer?

The Chicago Sun-Times has a monkey that they use to pick stocks. The monkey is named Mr. Adam Monk. The monkey picks 5 stocks each year and then the Sun Times pits the monkey's results versus the markets as a whole. He's been pretty successful: "In the four years since Mr. Monk has chaired and inspired this contest, his stocks have posted annual returns of 37 percent, 36 percent, 3 percent and, in 2006, 36 percent, beating the major indexes every time."


Ok so lets do a year by year comparison of the monkey's stock picks versus Jim Cramer's. The YourMoneyWatch website started tracking Cramer's picks in mid 2005 so they have full year data for 2006, 2007 and 2008.


2006 :


From the reference above, Mr Adam Monk's 2006 return = 36%

Jim Cramers 2006 picks result +7.67% gain.

2006 winner : monkey


2007 :

For 2007 Mr. Adam Monk picks were and their individual performance for 2007 :
Cygne Designs(CYDS) -64% : $2.30 to $0.82
Fresh Del Monte Produce (FDP) +115% : $14.90 to $32.17
West Pharmaceutical Services (WST) -16%: 48.19 to $40.37
American Medical Systems Holdings (AMMD) -28% : $19.91 to $14.28
Market 200 HOLDRS (MKH) +1% : $62.41 to $63.12
Net performance: +1.6%

Jim Cramer's picks for 2007 : +13.81%

2007 winner : Jim Cramer

2008:

2008 picks from Mr. Adam Monk:
Marvel Entertainment (MVL) +18% : $25.77 to $30.55
WellCare Health Plans (WCG) -70% : $41.99 to $12.36
Time Warner Cable (TWC) -26% : $82.41 to $60.60
Atheros Communications (ATHR) -52% : $29.94 to $14.31
Teradata (TDC) -46% : $26.87 to $14.41
Total return : -14.4%

Jim Cramer's picks for 2008 returned -29.8%

2008 winner: monkey

So there you have it. The monkey Mr. Adam Monk won in 2006 and 2008 but Cramer won in 2007.

Results : Monkey wins 2 out of 3 years.


Should we draw any conclusions from this? Well not especially. The monkey may just be lucky. I wonder if he could get a show in CNBC. The zany stage theatrics of Cramer's show would be better suited for a monkey.

Photo of monkey by dboy
Monkey pictured is not the actual stock picking monkey.

April 20, 2009

Are Solar Panels a Good Investment? (2nd look)


I looked at the financial practicality of buying solar panels for my home a while ago. At the time I concluded that the cost was just too high to warrant it given the returns. Since then however the federal government has improved the tax credit you can get for solar panels. Originally the tax credit was 30% of the cost with a maximum of $2000. But as part of the Emergency Economic Stabilization Act of 2008 they got rid of that $2000 cap on the tax credit. That makes solar panels much more economical. Before for a 2kW installation the cost could be about $15000 and the tax credit would be capped at $2000 but now the tax credit will be a full 30% or $4500.

You can get estimates on the cost of a solar panel system using the solar calculator [dead link] at FindSolar.com  [dead link]

Comparing a few different system sizes, it appears that based on the estimates for me a 2kW system would be about the "sweet spot" for best return on the investment. If I bought a 1kW system the payback would be 10.4 years. I could get twice as much system with a 2kW system and also have a 10.4 year payback. Once I start going over 2kW the payback period starts to increase more and more. My example numbers are below:

1kW system :
Cost = $11,900. Incentives = $10,400 Out of pocket cost = $1,500
Annual Electric savings = $144
Payback = 10.4 years

2kW system :
Cost = $15,900. Incentives = $13,900 Out of pocket cost = $2,000
Annual Electric savings = $192
Payback = 10.4 years

2.5kW system :
Cost = $19,800. Incentives = $15,900 Out of pocket cost = $3,900
Annual Electric savings = $240
Payback = 16.25 years

3kW system:
Cost = $23,800. Incentives = $17,900 Out of pocket cost = $5,900
Annual Electric savings = $288
Payback = 20.4 years


Keep in mind these are just estimates and they are specific to my region. The incentives very from state to state and utility to utility. Also the amount of electricity you save will be dependent on how much sun you get in your region. Your numbers are going to be different.

How does buying a solar panel compare to other investments? If I look at the 2kW system with a purchase cost of $2,000 and put the annual energy savings of $192 in the bank and compare that to putting the $2,000 in CDs / savings at 3-4% then I'd be ahead in about 10-13 years with the solar panels. If I could instead safely make 6% on my money then the payback would be around 12-16 years.

Looking at it another way if you bought a solar panel system today for $2000 and put your resulting annual energy savings into a bank account earning 3-4% you would have about $7,400 after 25 years. By comparison if you just took that $2000 and put it in the bank you'd have $4,188 in 25 years. In 25 years I'd be ahead over $3,200 if I buy a 2kW solar system.

What if I sold the house early? Say I went and put a 2kW solar panel on the house and then expected to break even in 10 years but we had to move for unforeseen reasons in 2 years. Would I get the money back? Remember that while my personal out of pocket cost is $2,000 but I'm getting a solar system worth $15,900. I found this source that claims that you get back $20 in home value for every $1 you save in electricity on a solar system. So my $192 annual savings should equate to $3,840 in home value. I think its a safe bet that if I had to sell the home then I'd get back at least the $2,000 out of pocket.

Given the current tax incentives I think that solar panels can be a good buy and are definitely worth a strong look. Should we all run out and buy solar panels? Well no. Instead I'd first look at other ways to cut your energy costs and do the items with the best bang for the buck first. I'm pretty sure I can get more bang for my buck by putting some money into weather sealing and extra insulation so I should pursue those first before putting $2,000 into solar panels. And the actual incentives you can get for buying solar panels and the energy savings you get from them will vary a lot from location to location.

Picture by richardmasoner

April 17, 2009

Best of blog posts for week of April 17th

Trent at The Simple Dollar questions whether 20 minutes of time is worth $10 in his article Ten Dollars, Twenty Minutes and it generated over 200 comments. I think making $30/hr after tax is good since its well above median US income.

My Money Blog has an interesting idea for a side job: Make Extra Money as a Phone Sex Operator?

In My Tenant: “I’ve Lost My Job and I Can’t Pay You…” Lazy Man considers what to do with a tenant that can't pay their rent. Is it worth evicting someone who's only there for another month or two? I say yes if it would cost you a months rent.

Backup Financial plan in Case of a Job Loss

Right now I have a pretty good paying job but my employer has had several rounds of layoffs over the past 10 years. Thinks are looking OK right now but I don't know if we'll get through the current recession without some job cuts. I'm fairly confident I will not be laid off any time soon, but you never know. Its best to plan for the worst and hope for the best.

For the past half your our spending has been about $4,250 a month. That is a lot of money for sure. But our monthly take home income is over $6,600. So while we spend a good amount, our income is pretty high so overall we're saving a lot as well. But if I lost my job we'd lose most of our income and our spending would have to change.

FIRST YEAR

Step #1. - Cut back our spending so our short term income will cover it.

One mistake I have seen from some people in todays economy is that they do not immediately and drastically cut their spending when they first lose their job. If I lost my job then we'd make immediate cuts to our discretionary / 'wants' spending.

We would cut our spending to something under $2800 a month. With severance, unemployment, our rental income and my wife's home business we should be able to cover that level of monthly expenses for maybe a year or so.

These are the areas that we'd cut back:

Eating out. Cut back about 90%. We'd probably still treat ourselves to an occasional, maybe monthly dinner out.
Travel. We'd cut any unnecessary travel. Most of our travel spending is on vacations and that could be cut significantly. Vacations are a luxury you can't afford if money is tight.
Entertainment - Cut back about 90-100%. We don't spend a huge amount of entertainment but we'd stop almost all of it.
Clothing - We can make due with the clothing we have. Cut 100%.
Cable TV / Netflix - Drop HBO immediately. We'd probably keep Netflix and cable at least in the short term. Cable is our primary form of entertainment and reasonably good value.
Gifts - Gift giving would have to take a back seat temporarily. Cut 100%.
Discretionary spending money - This category is misc. spending on stuff like an occasional latte or personal purchases of movies, games, books or whatever other miscellaneous spending. I'd cut this back 90-100%

Total cuts = over $1450 / month

Secondly I'd look for other areas to save money. I could probably cut some off the following expense categories:

Home Maintenance & Auto maintenance - These are two areas that I could cut costs significantly by either delaying repairs or doing the work myself.
Grocery / Drug store / home goods.I'm sure this category could be cut back a ways. we've been spending quite a bit on household goods and we could cut back further on our grocery bill with a bit of effort. ON the other hand our grocery costs would go up a little bit since we'd be eating out a lot less.
Gasoline - I'm not sure if we'd be able to cut gasoline spending. I'd not have to drive to work so that would cut it some but I might be doing other travel while job hunting.

Savings = unsure

Our mortgage, Garbage & water bills are fixed and not something we can cut back on.


Step #2 - Get health insurance, look for life insurance.

I would not want to go without health insurance. We'd probably take COBRA coverage short term and look for a high deductible plan with health savings account (HSA) after that. We have funds in our HSA that would cover COBRA for a while. Longer term we'd want to get our own plan since it would be a cheaper option. I'd also want to look for life insurance since my current coverage is through my employer.

Step #3 - Look for other cuts & find alternate income.

Longer term if I was unemployed for a while than we'd have to look at making deeper cuts.

Electricity
- We're fairly frugal with our electricity use. I don't see any easy or cheap ways to cut back. We could cut the heat down and save that way but this is not a first step for us.
Insurance - We might be able to shop around and get a better rate. But we're very happy with our current provider. Cutting insurance cost would not be a first step.
Cell phones - We could probably cut our cell phones down a lot if not get rid of them entirely. That would be something we'd have to think about.
Phone and Internet - We could cut our phone and internet. Lower internet would mean a slower service. Not something we'd like at all given my wife has a home business and uses the net a lot.

I could probably cut $100-200 off our bills with a bit of effort

That would bring our spending down to $2600 to $2700 level.

I'd also look for other income sources. I'd probably try working on the side doing computer service work. Or I might spend effort helping my wife with her home business. We'd do whatever would net us the most income. Hopefully that would be enough to add some to our monthly income.

SECOND YEAR

Step #4 - Sell real estate

If I'm unemployed for longer than a year we'd start dipping into savings. Thankfully we have a very healthy cash reserve and our savings would last us a while. But at this point I think it would be smart for us to consider selling either our home or a rental.

We have a rental with enough equity to pay off our home mortgage. If we sold that rental then we'd be able to pay off our mortgage and knock over $1000 off our monthly expenses.

This would bring our monthly expenses down to less than $1700.

OVER TWO YEARS

Step #5 - Career change and/or move

If things didn't look up for a couple years then we'd most likely consider a major change in our life. I might make a total career change. That could include going back to school for training in a different field. We might also consider moving somewhere with lower cost of living.


While I hope I am not laid off any time soon, I think it is important to have a plan just in case.

April 16, 2009

An example of Whole Life insurance investment return

A week or two ago on the Suze Orman show she had a caller with a whole life insurance policy. Put very simply a whole life insurance policy is an insurance policy that has a cash value built up. The caller in question was 38 years old. He had a whole life insurance policy with $200,000 worth of death benefit. He had been paying $50 a month for 15 years. His cash value in the policy was currently $9,200. He was wondering if he should keep the policy or what. Suze generally hates cash value life insurance such as whole life. She told him to cash out his policy and get a term insurance policy instead.

On first glance this isn't a horrible investment. HE didn't lose money and he has $9,200 in the bank. I'd say he didn't get "ripped off" with this policy but he could have easily done better by buying term and investing the difference. Lets look at the alternatives he has with term insurance and how that might have worked out for him.

Term insurance is cheap. You can get quotes for term insurance at Quick Quote without having to give personal info. A quick search on Quick Quote shows that if the caller were in good health then he could get $200,000 of coverage with a 20 year term policy for as low as $156 a year. That's $444 less than he's currently paying for the whole life policy. That gives him a lot to invest. What if he'd done that from the start? Lets say he was 23 today and he had the choice to make again, then he could get the $200,000 term policy for as low as $134. Thats $466 a year less than the whole life policy. If he put that $466 a year into a safe investment making 4% then in 15 years he'd have accumulated about $10,170. The callers investment on the other hand netted him $9,200 at the end. To get that amount of cash value with $466 a year you'd have to get about 2.75% interest.

Whole policy: $200,000 coverage at $600 a year = $9200
Term policy & invest the rest : $200,000 coverage for $134 a year + $466 in savings at 4% = $10,170

He would have come out ahead with the term policy by $970.

Now I am assuming a 4% return for 15 years. I chose that 4% since I think its a typical safe, long term return. I think it shouldn't be hard to safely hit 4% after tax on investments. If you have a home mortgage you are probably paying 5-6% on it so throwing extra money into your mortgage principal would net you around 4%. You could also invest in bonds which have historically averaged 6% returns. And to be a true apples to apples comparison the returns on your investment would have to be after tax or tax sheltered.

Another thing to consider is if you have enough insurance. $200,000 is not that much insurance really. If the caller had $50 to spend on insurance he could have instead gotten $1,000,000 coverage from a term policy for that much. The first priority with insurance is to make sure you have enough. This is another reason that term insurance is better since you can get a lot more coverage for the same price.

April 15, 2009

Free compact flourescent lamp (CFL) at Home Depot on April 19th

Home Depot is giving away 1 million CFL's on April 19th. Here is the promotion detail.

Earth Day 1 Million CFL Light Bulb Giveaway
The Home Depot will be giving away 1 million CFL bulbs in support of our environment on Earth Day 2009. Receive a free EcoSmart 14w CFL bulb from participating The Home Depot stores on April 19, 2009. Quantities may vary by store. Limit one per customer while quantities last. No purchase necessary. Offer cannot be combined with any other promotional offer or discount. No credit if offer refused.

Found this one on Fatwallet.

Discount Deals for today : Tax Day

This article from Yahoo lists a number of discount promotions that various retailers and restaurants are offering. You can get 15% off at PF CHangs. Cinnabon has FREE cinnamon-roll bites from 5PM to 8PM. McCormick and Schmick's has a $10.40 entree menu. Check out the Yahoo article for other deals.

I found this one via Fatwallet

The Cost of Computers over Time

The Bureau of Labor Statistics tracks consumer price data. Computer equipment is one of the price categories that they track. Below is the trend in the price index of "personal computer and peripheral equipment" for the past 10 years

As you can see the price of computers has dropped drastically over the years. From 1999 to 2003 the index dropped over 20% every year. Lately the rate of price drop has slowed but the prices for computers are still dropping. The index has decreased at a rate of 11-12% annually for the last 3 years.

Remember this is an index of prices so its not directly related to a specific dollar amount for a specific item. They are looking at personal computers and peripheral equipment prices as a whole so its a combination of everything in that category: very expensive computers, cheap computers, monitors, printers, etc. So while the overall prices may have gone down from a 700 level to 100 level that doesn't mean that any individual computer part you buy today will cost 1/7th of what it cost 10 years ago. For example the cheapest Dell system today costs about $400 but the cheapest Dell 10 years ago was not 7 times that much.

Overall this kind of price trend does matches reality pretty well. I remember in the late 1980's that an IBM PC would cost in the ballpark of $3000. I remember spending about $1500 for my first real PC back around 1994. Today you can buy a decent Dell system for around $400. A printer today can be bought for as little as $25-$50 on sale but 10 years ago they'd easily run $150-$200 minimum.

From the index and from direct observation, its clear that personal computer prices have been steadily decreasing over the past decade.

April 14, 2009

History of homeownership rates

On my post "Home foreclosure rates past and present.", a commenter, Randy, asked about historical home ownership rates versus foreclosure rates.

Randy's comment:

"Have you looked at foreclosure rate graphed with home ownership rates? My understanding is that home ownership reached new highs in the last few years, I would think foreclosure rates would have followed (but delayed)."


First lets look at historical home ownership rates.

The census tracks home ownership rates. Here is a table of home ownership rates for the US and per state for each of the 10 year census from 1900 to 2000. We can also find more recent home ownership rates from 1900 to 2007 in the 2009 Statistical Abstract. Using those two sources I can plot a graph of the home ownership rate over the past 100 years:

You can see that from 1900's to the 1940's the rate was fairly stable in the 40% range. Then from 1940 to 1960 home ownership increased substantially and jumped up to the 60% level. From 1960 until today the home ownership rate has been in the 60% range and has gradually gone up over the decades. Note that most of the census data is only for 10 year intervals so it doesn't show every year. I could probably find some more data for individual years by pulling it out of historical statistical abstracts but I doubt that there was much variation in home ownership for any given 10 year period.

How does the home ownership rate compare to the foreclosure rate? Below I've charted the rate of foreclosures versus the home ownership rate.


The home ownership rate is the pinkish line with the figures on the left column. The foreclosure rate is on the blue line with the figures on the right column. Both have been generally trending upwards over time. Given the data I looked at, I don't see any direct relationship between home ownership rates and foreclosure rates.

Now this is not to say that there isn't any relationship between the two. Obviously if you gave everyone in the country a home that they couldn't afford then there would be 100% home ownership but the foreclosure rates would increase. Another thing to consider is that the data on home ownership rate doesn't tell us how affordable those homes and it doesn't tell us how many people have mortgages. Home ownership alone doesn't really give us a good predictor for foreclosure rates. What if 75% of us owned homes but only 10% of those people had a mortgage and the rest owned the homes outright? What if 50% of us owned homes and 90% of us had mortgages? I think that such things as the affordability of the homes in relation to wages, the level of equity in homes, and general economic conditions would probably show more direct relationship to foreclosure rates than simple home ownership rates.


April 13, 2009

Diamonds are NOT an Investment


Diamonds are pretty. Diamonds make great jewelry and most of us will end up giving or getting a diamond ring sometime in our lives. While they make great jewelry, diamonds do not make good investments.

There are a number of reasons that diamonds do not make good investments.

The BIG problem with diamonds as an investment is that there is no public market in them. You can't simply go to your local stock broker or bank and cash in your diamonds. In order to sell a diamond you'll have to go to a jeweler or pawn broker. When you buy the diamond you are normally paying a retail price. So the diamond has a mark up in the price you pay above wholesale. Then when you sell the diamond you will get quoted a price below wholesale so that the buyer can make a profit and then resell at wholesale value.

The article Have You Ever Tried to Sell a Diamond? from The Atlantic in 1982 discusses the whole diamond business and how investing in diamonds is difficult.

A couple examples of reselling diamonds are covered in The Atlantic article. First a long term experiment tried in England years ago:

"in 1970, the London-based consumer magazine Money Which? decided to test diamonds as a decade long investment. It bought two gem-quality diamonds, weighing approximately one-half carat apiece, from one of London's most reputable diamond dealers, for £400 ... tried to sell the diamonds in 1978 ... Most of the stores refused to pay any cash for them; the highest bid Watts received was £500, which amounted to a profit of only £100 in over eight years, or less than 3 percent at a compound rate of interest. If the bid were calculated in 1970 pounds, it would amount to only £167."

So over 8 years they saw 3% gain without considering inflation. Not particularly good.

This quote also gives us an example price from 1970 we can compare to today's prices. We can do a quick compare to see how those 1970 prices compare to today's prices. They bought two half carat diamonds for £400. That is about $584 in today's exchange rate for about $292 for a 0.5 ct diamond. Today I searched BlueNile and Amazon for loose diamonds. The cheapest 0.5 ct. diamonds I found were $573 on BlueNile and $465 on Amazon. Going from $292 in 1970 to $573 today is a 1.7% rate of increase over 39 years.

Then they also say: "For example, Brod estimates that a half-carat diamond ring, which might cost $2,000 at a retail jewelry store, could be sold for only $600 at Empire." (keep in mind that article was written in 1982). That would have been a 70% loss in value between buying and selling.

For something more recent, Yahoo has an article The Great Used Gold Rush of 2009 that talked about people selling their old jewelry and gold. They say that resell on a 1 carat diamond ring : "Of course, what you can expect to be paid will always depend on the diamond, but for an average near-colorless and slightly imperfect stone, expect close to $1,000 or more." If you were to go and buy a 1 carat ring today you'd spend at least $1500 but more commonly closer to $2500-$3000 range. The very cheapest 1 ct. loose diamond I found was about $1400 on Amazon and 1 ct. diamonds started at over $2200 on BlueNile. So you're talking about buying a ring for $1400 to $3000 and its resale value being around $1000. Right off the top you're losing 25-66% of the purchase value.

Another major concern with treating diamonds as an investment is that the entire world diamond market is manipulated and controlled to some extent by the De Beers cartel. This means that the prices paid for diamonds are artificially influenced by DeBeers. Why is this a concern? The DeBeers cartel is artificially inflating diamond prices to suit their own interests. At any time its possible that another entity could develop their own diamond source and undercut DeBeers and this would then cause the entire market for diamonds to be impacted. I do not think it is too likely that DeBeers will lose their grip on the diamond market but it is a possibility.

Key reasons Diamonds do not make good investment:

  • You have to pay a markup when you buy and get a discounted price when you sell.
  • They are not liquid.
  • Long term gains have been single digit % levels.
  • The entire market is controlled by a cartel.

Picture by mafic

April 12, 2009

Could you cash in If "cash for clunkers" is implemented?


Congress has been considering a "cash for clunkers" program where they would give vouchers for people who trade in older less fuel efficient cars. The goal would be two fold. First it would give a stimulus to get people buying new cars. Second it would remove old fuel efficient cars from use thus lowering our use of foreign oil and helping the environment. My immediate thought about such a system is that people would game it to buy old clunkers for cheap and then trade them in for the vouchers thus profiting off the program.

Here's specifics on how the program, as proposed, would work:
"Drivers would be eligible for reimbursement for purchase of a new or used vehicle with a fuel economy rating that exceeds federal targets for that class of vehicle by at least 25 percent. The vehicle must have a manufacturer suggested retail price of less than $45,000 and be a model year 2004 or later. The vehicles turned in must be drivable, registered in the United States and have a when-new fuel economy rating of less than 18"
"In the first year of the program, a person trading in a vehicle that is model year 2002 and later would be eligible to receive $4,500 for purchase of a new vehicle, $3,000 for purchase of a used vehicle or $3,000 for transit fare credit. For model year vehicles 1999 to 2001, drivers would get $3,000 for the purchase of a new vehicle. Those who trade in vehicles that came out in 1998 or before could get a credit of $2,000 for a new vehicle."

I checked Autotrader for my 200 mile radius from my zip code and I didn't find any 2002 or newer vehicles for under $3000 that would qualify. So I don't see any potential to game the system for a used car. If you're looking to buy a new car then you might be able to find a used car to buy to get a voucher. Looking at the 2002 and newer vehicles I found one van for about $3500. That would get you a $4500 credit. There were a handful of cars in the 1998 to 2001 age range that were under $3000. But not by a lot. Once you get down to the 1998 and older cars I did find a few for under $1000 that might be usable to get a $2000 credit.

THere are a few cars out there that you could buy and then trade in at a profit. But the profit is not that substantial and seems to max out around $1000 range. Part of it is that the "clunker" car must have relatively low fuel efficiency. Then the only way to profit off the resale of a clunker would be to buy a new fuel efficient car.

My conclusion is that there are very few used cars out there selling for low values that would give you a significant profit through this program. Probably more importantly, as soon as a program like "cash for clunkers" went into effect the sale prices of the "clunkers" that qualify would go up as a reaction.

Image sources by Tracy O and kwags1

April 10, 2009

Best of blog posts for week of April 10th

JD at Get Rich Slowly has a good article about prioritizing time over money Finding Balance Between Time and Money

Generation X Finance points out that March 2009 Was a Perfect Example of Why You Shouldn’t Try to Time the Market Its good article to read if you're worried about you're starting to get nervous about the "buy and hold" strategy.

Good example of a bad Universal Insurance purchase

The other day on the Suze Orman show a woman called in to ask a question about her Variable Universal Life Insurance policy. Variable Universal life policies are a cash value life insurance policy that has the option to invest in different investment vehicles such as mutual funds or bond funds. The performance of the investment has some risks due to the volatility of the investments. There are some common criticisms of Variable Universal Life policies: high costs, limited investment choices and policy expenses can increase.

Here are the details on the woman's policy given on the show:
$300,000 Death benefit
$100 / month premium
60% fees
$13,500 total investment over 5 years
$6,725 cash value

So she had paid the premium for 5 years and spent $13,500. They said the premium was $100 a month which would be $6,000 for 5 years so I'm guessing that she put extra money in and/or there were other fees. They didn't explain how the 60% fees worked or what the fees were for. This is the information given in the show so I'm taking it at face value. Plus they didn't say anything at all about how she had allocated her investments within the policy. She may or may not have made risky choices for the investments. In any case she had spent $13,500 over 5 years and had $6,725 value built up.


Lets compare that to buying a term policy for $300,000 coverage:

A healthy woman in her 30's can get a 20 year term policy with $300,000 coverage for under $200 a year. If the woman had bought such a term policy and simply put her money in a bank account with 1% interest then she'd have over $12,750 in the account. Thats about $5,975 more than the cash value of the universal policy.
Or what if you were a little more risky with it and put your extra cash into a S&P500 index ETF once a year? Even with the plunge in the value of the stock market you'd still be ahead with over $8,500 in stock left.

Lets sum up:
Option 1: Variable Universal life policy = $6,775 in cash value after 5 years
Option 2: Term life + save the rest in a simple savings account = $12,750 in cash value after 5 years
Option 3: Term life + invest the rest in S&P 500 ETF fund = $8,500 in cash value

Clearly in this case the choice to buy the Variable Universal Life policy was not a good one. She would have done better simply buying term and investing the rest in the S&P500, even with the recent drastic plunge in the S&P.

April 9, 2009

Take Advanced Placement classes to Save on College

Advanced Placement (AP) classes are courses that you can take in high school which may gain you college credit. Most colleges recognize AP courses for additional credit and/or advanced placement. When I went to school I had taken 3 AP courses and scored high enough to get credit. I had a total of a full quarter worth of credits so thats 1/3 of a school year. Its possible that helped me graduate a quarter earlier than I would have otherwise. The AP courses definitely helped prepare me better for college and helped make graduating in 4 years easier.

There are some great benefits to AP classes:

  • AP coursework and the AP exams help better prepare you for college. - AP classes are harder than typical high school classes and much closer to the difficulty level of a college course. The AP exam is very similar in nature and difficulty to a college final exam.
  • AP classes help you get ahead in your college courses so you can manage your course schedule easier. - If you are a few courses ahead in your schedule then it will be that much easier to shuffle around the other courses that you need to take.
  • The extra credit in college can help you graduate earlier and save you money. - This is a big one. AP classes will put you ahead in your credit and course totals. This can help you graduate faster than without them.

Say for example that taking the AP courses that I took helped me graduate one quarter earlier (three months). In today's prices that quarter would equate to potential of over $6,000 in savings for tuition and room and board. Plus I'd be in the work force 3 months sooner and potentially gain 3 months additional wages.

AP classes do require more work and you have to do well. If a student normally gets high grades then AP classes can be a good option to challenge a student further and give them a leg up on college and its costs.

April 8, 2009

Net Worth Update : March + $12,558

I track my net worth monthly on NetworthIQ. Since my update in last month for Feb. my update for March 2009 my net worth increased $12,558. Most of the update was due to rebound in the stock market. My retirement and stock accounts were up. Real estate equity dropped marginally. Cash assets were roughly flat. Our liabilities in mortgages were down a bit.

April 7, 2009

Privacy Policy regarding Google Adsense

Here are some details about the ads served by Google on this site:

  • Google, as a third party vendor, uses cookies to serve ads on this site.
  • Google's use of the DART cookie enables it to serve ads to users based on their visit to this site and other sites on the Internet.
  • Users may opt out of the use of the DART cookie by visiting the Google ad and content network privacy policy.

An Example from the Depression on Why You should Keep investing

If you had invested $1000 annually in the Dow Jones industrial index every year from 1929 to 1937 you would end up with $13,519. That amounts to an annual growth rate equivalent to about 6.5%.

The Dow started around 300 in 1929 then plummeted to less than 100 by 1933. Then from 1934 to 1937 the Dow steadily grew.


The green bars show the total balance of stock owned for each year. The blue plot line shows the Dow average.

You can see if you steadily plowed your money into the market every year that at the end of it all your investment would have grown significantly.

Notice from 1929 to 1932 your investment balance looks pretty bad. You've spent $4000 on stocks and by 1932 its worth less than $2000. Many people get scared when their money drops off significantly like that. The bottom is when a lot of people are tempted to take their money out of the market. When they do that they are effectively buying high and selling low. That is the exact opposite of what you want to do.

What would have happened to your money if you got scared in 1932 and cashed in your stocks and then started investing in stock again in 1935? If you held cash from '32 to '35 then you would have missed out on buying relatively cheap stocks in '33 and '34 and then you'd miss on the growth in the equities from '32 to '35. The end result would be that if you sat on the sidelines of the market for 3 years between 1932-1935 then by 1937 your portfolio would be worth $10,801 or 20% less.

What if you just sat out for 1 year? Say you watched your investment gradually go down from 1929 to 1932. Then in 1933 you say "enough!" and you sell your stocks and sit on the cash. Then in 1934 you see the market going up again so you take your cash and buy stocks again. You effectively timed it so that you missed the bottom. That might sound good but what you really missed was the opportunity to buy low. By 1937 you would have $11,085. Thats 18% less than if you'd riden it out.

The best way to ride out a recession is to continue to invest your money into the market in a periodic basis. This way you can be sure to catch the opportunity to buy low and the growth of the market as it recovers high.

Now keep in mind that you should only be investing in the stock market for a long term goal. If you need your money within 5 years then it should not be riding in stocks. But if your investment horizon is 10 - 40 years then stocks are a good place to invest.

April 6, 2009

Income versus Age and resulting tax brackets

The Census site has data on household income by age of householder. The data there is from 2007 so its fairly recent. It is interesting to look at typical income levels for people of various age groups.

First lets look at median income for different age levels. The median income figures for each 5 year age group are as follows:

Median Income
25 to 29 years $47,358
30 to 34 years $55,077
35 to 39 years $61,782
40 to 44 years $62,578
45 to 49 years $64,802
50 to 54 years $66,244
55 to 59 years $61,174
60 to 64 years $52,428
65 to 69 years $40,296
70 to 74 years $31,654
75 and older $23,230


Graphically the median income levels look like this:


Current median income rises are higher for people in older age groups through their 20's, 30's, 40's and 50's. Then as people hit their late 50's and get above the older they are the lower the median income are.

Remember this is just a snapshot of one year. It doesn't follow an individual. So I would not necessarily look at this data and conclude that peoples incomes go and down in this similar plotline as shown in the graphic. I would not assume for example that your income will go down as you age after retirement. Its possible that people in later years have fixed income or incomes that increase at a slower rate and are working less and less. So simply compared to younger people their incomes look lower since they have been increasing at a slower pace over decades. On the other hand people of working age are getting annual raises and gaining more work experience and gradually getting other sources of income.

Whatever the cause, its obvious that people in retirement age typically have lower income levels than people of working ages at any given time.

In fact if you compare median income of people above 65 to people below 65 the difference is pretty significant. People under age 65 have a median income of $56,545 and people over age 65 have a median income of $28,305.

While the median tells us where the middle income level will be its also good to look at how income is distributed for each given age group. I figure one good way to do that is to break income into groups that roughly equate to the federal income tax brackets. So using the 2007 tax brackets for a married couple I broke income levels into 4 groups. People making under $15,000 which roughly equates to the 10% bracket, people making between $15,000 and $62,500 which is about the 15% tax bracket, people making from $62,500 to $100,000 which falls into the 25% bracket and then finally people making over $100,000 which is everyone else including the top part of the 25% bracket and up.

Now lets look at how the income of people of different ages falls into these groups.

For people under 65 versus people over 65 it looks like this:


While the largest income group for either age is in the middle, the people over 65 are more often in the lower group and people under 65 are more often in the higher group . People over 65 years old make under $15,000 twice as often as people under 65. People over 65 make over $65,500 half as often as people under 65.

Now lets look at the income distribution for people over each 10 year age group:


People in their early ages are more often making lower income compared to people in their 40's and early 50's. But by the time that people hit their 50's and 60's or older they are more often making lower incomes.

Since these income levels are roughly divided to coincide with the tax brackets we can see a rough picture of how people of different ages fit into different tax brackets.

80% of people over 65 are in the 10% & 15% brackets and only 20% of them are in the 25% and higher brackets.

53% of people under 65 are in the bottom 10% & 15% brackets while 47% are in the 25% and higher brackets.

Looking at the actual income distributions for age I would conclude that in general people are more often in lower tax brackets when they are retired.

Notice I've got the words 'in general' in italics above. The data represents medians which is a indicator of where the middle falls. It is important to keep in mind that median numbers aren't any real indicator of what we as individuals will see for ourselves. Each of us is different so our individual income picture in the past, present and future will vary. In short, just because retired people are typically in lower tax brackets doesn't mean you will be too.

April 5, 2009

How many hours does it take to build a car?

Before I talked about the inflated wage figures we've heard about US auto makers are not true.

Hourly wages are only part of the equation though. You also have to look at the time it takes to build a car since hourly wages x hours = labor cost. So how many hours does it take on average to build a car?

Article from Quality Digest : Are Union Shops More Productive? lists the average time to build a new car for the major auto makers:

Toyota: 19.46 hours
Honda: 20.62 hours
GM: 23.09 hours
Ford: 24.48 hours
DaimlerChrysler: 25.17 hours

The Japanese auto makers are better on average. Toyota is 23% faster than Chrysler.

But the time to make a car varies from plant to plant. Older plants have outdated equipment and designs and are less efficient. The Japanese plants in the US are newer and generally better facilities. The Quality Digest article also lists the most efficient individual auto manufacturing plants.

6 of the top 10 plants in the US are from GM, Ford & Chrysler. The most efficient plant is a GM plant in Canada at 15.85 hours per car.

Note that the article is from 2006 so its a little dated (hence the reference to DaimlerChrysler).

April 4, 2009

Unemployment by state for Feb. 2009

Unfortunately there are 7 states with over 10% unemployment. The worst hit are: Michigan 12%, South Carolina 11%, North Carolina 10.7%, Oregon 10.8%, California 10.5%, Rhode Island 10.5% & Nevada 10.1%

In the good news category there are 11 states under 6% unemployment. The best off are: Wyoming 3.9%, Nebraska 4.2%, North Dakota 4.3%, South Dakota 4.6%,Iowa 4.9%, Utah 5.1%, New Hampshire 5.3%, New Mexico 5.4%, Oklahoma 5.5%, Louisiana 5.7%, Kansas 5.9%.

The data is from the Bureau of Labor Statistics. There is a graphic map of the nation with each state's unemployment rate.

Below is the list per state:


State February
2009
Alabama 8.4
Alaska 8.0
Arizona 7.4
Arkansas 6.6
California 10.5
Colorado 7.2
Connecticut 7.4
Delaware 7.4
District of Columbia 9.9
Florida 9.4
Georgia 9.3
Hawaii 6.5
Idaho 6.8
Illinois 8.6
Indiana 9.4
Iowa 4.9
Kansas 5.9
Kentucky 9.2
Louisiana 5.7
Maine 8.0
Maryland 6.7
Massachusetts 7.8
Michigan 12.0
Minnesota 8.1
Mississippi 9.1
Missouri 8.3
Montana 6.0
Nebraska 4.2
Nevada 10.1
New Hampshire 5.3
New Jersey 8.2
New Mexico 5.4
New York 7.8
North Carolina 10.7
North Dakota 4.3
Ohio 9.4
Oklahoma 5.5
Oregon 10.8
Pennsylvania 7.5
Rhode Island 10.5
South Carolina 11.0
South Dakota 4.6
Tennessee 9.1
Texas 6.5
Utah 5.1
Vermont 7.0
Virginia 6.6
Washington 8.4
West Virginia 6.0
Wisconsin 7.7
Wyoming 3.9

Blog Widget by LinkWithin